What's new
Kaspersky Unified Monitoring and Analysis Platform introduces the following features and improvements:
• Changed the storage location of the self-signed CA certificate and the certificate reissue mechanism.
The certificate is stored in the database. The previous method of reissuing internal certificates by deleting certificates from the Core file system and restarting the Core is no longer allowed and will cause the Core to fail to start. Until the certificate reissuing process is completed, new services may not be connected to the Core.
After reissuing the internal CA certificates in the Settings → General → Reissue internal CA certificates section of the KUMA web interface, you must stop the services, delete the old certificates from service directories, and manually restart all services. Only the General Administrator can reissue internal CA certificates.
- KUMA now also supports the following operating systems:
- Ubuntu 22.04 LTS
- Oracle Linux 9.4
- Astra Linux 1.7.5
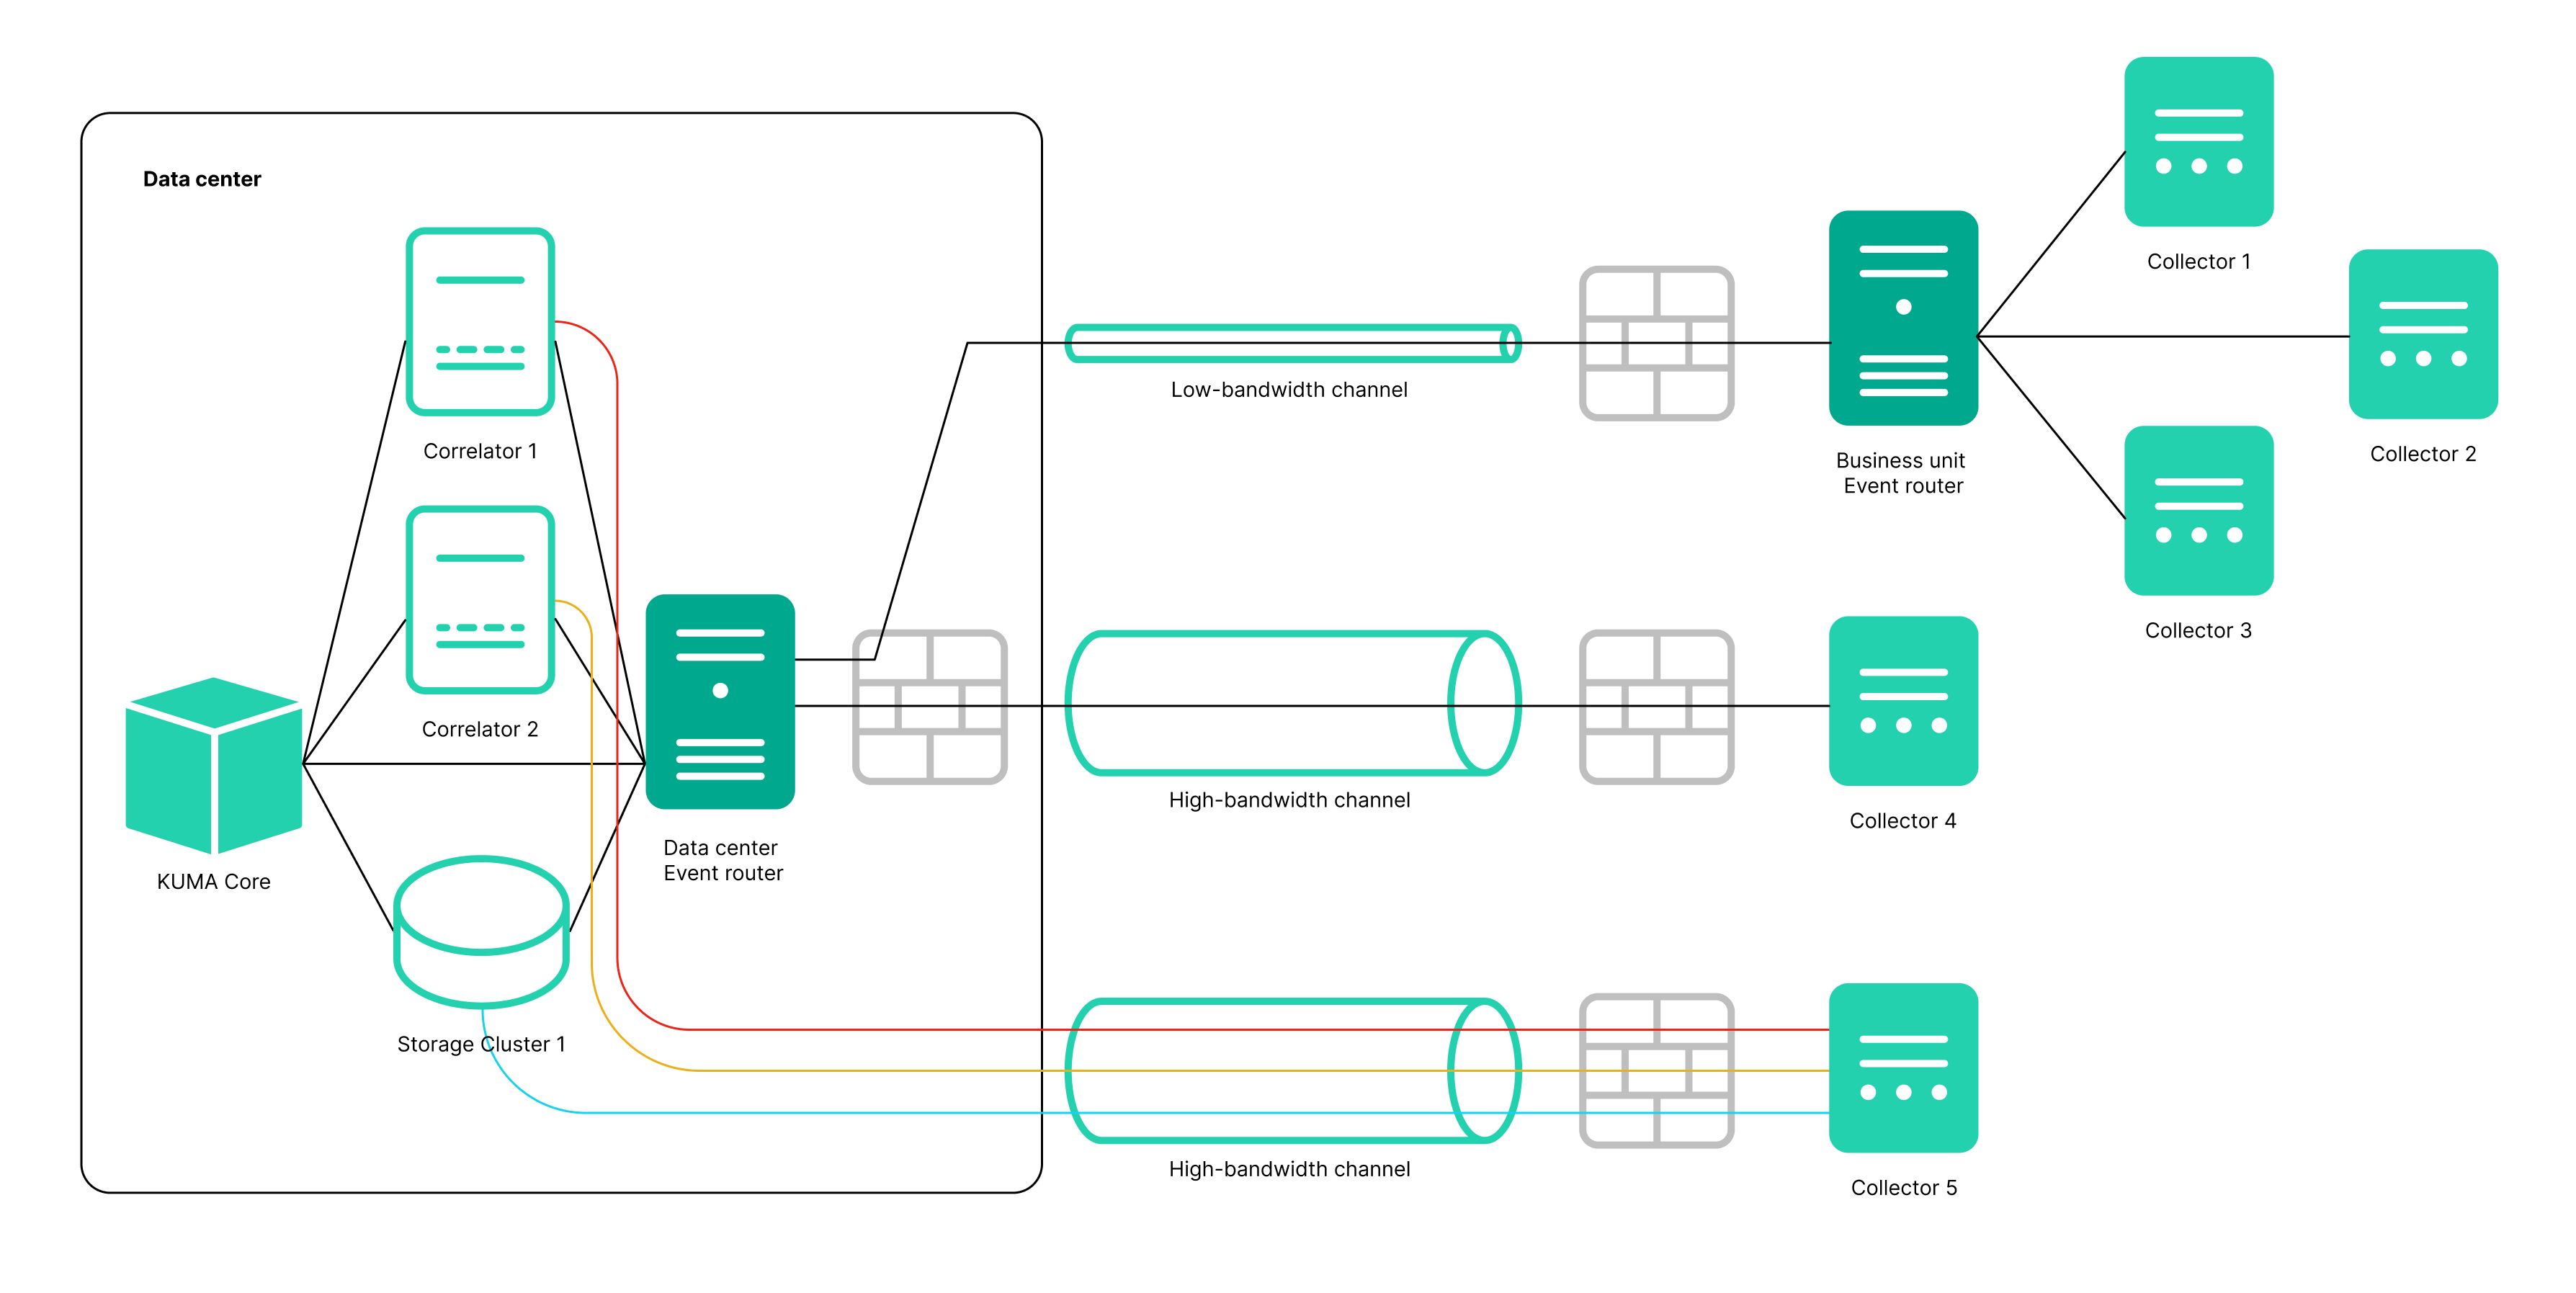
- Added the Event router service. This service lets you receive events from collectors and send events to specified destinations in accordance with the filters configured for the service. An intermediate service like this enables effective load balancing between links and lets you use low-bandwidth links. For example, as shown in the diagram in the expandable section, instead of sending events as multiple streams from collector 5 to the destinations, you can send events as one stream: in the diagram, collector 1 + collector 2 + collector 3 send events to the router of the local office, then to the router of the data center, and from there the events are finally sent to the specified destinations.
Diagram of event transmission with and without an event router
- NCIRCC integration — updated list of fields and incident types, added the ability to submit information about personal data leaks. Exported incidents with an old type that is no longer supported are displayed correctly.
- Grouping by arbitrary fields, using time rounding functions from the event interface.
When conducting an investigation, you need to get selections of events and build aggregation queries. Now you can run aggregation queries simply by selecting one or more fields you want to group by and doing "Run query". Aggregation queries with time rounding are available for date fields.
As a result, you can see both the groups and the grouped events without rewriting the search query. You can navigate the groups, flip through the lists of events included in the group, and view the fields of event, which makes your job easier and lets you get your result quicker when investigating.
- Now you convert a source field using an information entropy calculation function. In the collector, you can configure an enrichment rule for a source field of the event type, select the entropy conversion type, and specify a target field of the 'float' type in which you want KUMA to place the conversion result. The result of the conversion is a number. Calculating the information entropy allows detecting DNS tunnels or compromised passwords, for example, when a user enters the password instead of the login and this password gets logged in plain text. Typically, a login consists of alphabetic characters, and the conversion calculates the information entropy and returns, for example, 2.5416789. If the user mistakenly enters the password in the login field and so the password ends up in the log in plain text, KUMA calculates the information entropy and outputs, for example, 4 because a password containing letters, numerals and special characters has a higher entropy. In this way, you can find events in which the user name has an entropy more than 3, and trigger a "password change required" rule in such cases. After configuring enrichment in the collector, you must update the settings to apply the changes.
- You can search for events in multiple selected storages simultaneously using a simple query. For example, you can find events to determine where a user account is being blocked or which IP addresses were used to log in to which URLs.
Some installations may require using multiple separate storages, for example, in cases of low-bandwidth links, or regulatory requirements to store events in a certain country. Federated search allows running a search query on multiple storage clusters simultaneously and getting the result as one combined table. Finding events in distributed storage clusters is now quicker and easier. The combined table of events indicates the storage in which a record was found. Grouping queries, retroscan, or export to TSV are not supported when searching in multiple clusters.
- Coverage of a MITRE ATT&CK matrix by rules
When developing detection logic, an analyst can be guided by the mapping of content to real-world threats. You can use MITRE ATT&CK matrices to find out the techniques to which your organization's resources are vulnerable. As an aid to analysts, we developed a tool that allows visualizing the coverage of a MITRE ATT&CK matrix by the rules you have developed and thus assessing the level of security. The functionality lets you:
- Import an up-to-date file with the list of techniques and tactics into KUMA.
- Specify the techniques and tactics detected by a rule in its properties.
- Export from KUMA a list of rules marked up in accordance with a matrix to the MITRE ATT&CK Navigator (you can specify individual folders with rules).
The file with the list of marked up rules is displayed in the MITRE ATT&CK Navigator.
- Reading files by the Windows agent.
The KUMA agent installed on Windows computers can now read text files and send data to the KUMA collector. The same agent installed on a Windows server can send data both from Windows logs and from text files with logs. For example, you no longer need to use shared folders to get Exchange Server transport logs, IIS logs, and so on.
- Getting DNS Analytics logs using the etw connector.
The new ETW (Event Tracing for Windows) transport used by KUMA Windows for reading a DNS Analytics subscription allows getting an extended DNS log, diagnostics events, and analytical information about the operation of the DNS server, which is more information than the DNS debug log provides, and with less impact on DNS server performance.
Recommended configuration for reading ETW logs:
- Create a new collector:
- Create a dedicated collector for ETW logs.
- Create an 'etw' connector, an agent will be created automatically.
- Specify the connector in the collector.
- Install the collector and the agent.
- Create a collector and edit the settings of an existing manually created agent:
- Create a collector with 'http' transport and \0 delimiter, and specify the "[OOTB] Microsoft DNS ETW logs json" normalizer.
- Save collector settings.
- Install the collector.
- In the existing WEC agent, add an additional configuration, and in it, specify the 'etw' connector, and as the destination, specify the collector created at step 'e'; 'http' as the destination type; and \0 as the delimiter.
- Save agent settings and start the agent.
- Create a new collector:
- CyberTrace enrichment over the API.
Cybertrace-http is a new streaming event enrichment method in CyberTrace that allows you to send a large number of events with a single request to the CyberTrace API. Recommended for systems with a lot of events. Cybertrace-http significantly outperforms the previous 'cybertrace' method, which is still available for backward compatibility
- Activation with a code.
Now you can activate KUMA using an activation code. With this method, you do not need to worry about importing new keys into KUMA when renewing or reconfiguring your license. To activate with a code, your Core server needs access to several servers on the internet. The old activation method with a license key remains available to users.
- Optimized transmission of events in CEF format. Transmitted events include the CEF header and only non-empty fields. When events are sent to third-party systems in CEF format, empty fields are not transmitted.
- Events can now be received from ClickHouse using the SQL connector. In the SQL connector settings, you can select the Database type for the connection, which automatically specifies the prefix corresponding to the protocol in the URL field.
- The 'file', '1c-log', and '1c-xml' connectors now have the 'Poll interval, sec' setting, which sets the interval for reading files from the directory. Adjusting this setting can reduce CPU and RAM consumption.
- The '
airgap' parameter was removed from the inventory file. If your inventory file still contains the 'airgap' parameter, the installer ignores it during installation or update. - Secrets of the URL and Proxy types no longer contain the login and password. Added the ability to transform the password.
- Fields containing a value in addition to the key have been added to service events about an entry dropping out of the active sheet and context table. Fields with values provide more flexibility in writing correlation rules for processing such service events.
- The list of statuses for services has been updated: the blue status has been added, and the applicability of the yellow status has been expanded.
- Now you can go from the 'Source status' section to the events of the selected event source. Qualifying conditions in the search query string are generated automatically after clicking the link. By default, events are displayed for the last 5 minutes. If necessary, you can change the time interval setting and repeat the query.
- Collecting metrics from the agent.
The Metrics section now has a subsection where the performance of the agent is visualized. This graphical view helps administrators who are responsible for collecting events using agents.
- Added support for the compact embedded SQLite 3.37.2 database management system.
- Added the 'elastic' connector for receiving events from Elasticsearch versions 7 and 8. A fingerprint secret has been added for the connector.
- For connectors of the tcp, udp, and file types, the following auditd log event processing options have been added:
- The Auditd switch lets you handle multi-line events and combine records into a single event.
- The event buffer TTL setting determines how long the collector must accumulate event lines to then merge them into a single multi-line event. The value is in milliseconds.
- Now you can configure a list of fields for event source identification. DeviceProduct, DeviceHostName, DeviceAddress, DeviceProcessName is the set of fields used by default for identifying event sources. Now you can redefine the list of fields and their order. You can specify up to 9 fields in a sequence that is meaningful to the user. After saving changes to the set of fields, previously identified event sources are deleted from the KUMA web interface and from the database. You can still use a set of fields for default event source identification.
- Added the iLike operator to the event search query graphical design tool.
- Updated the list of REST API methods. Description of v2.1 methods is available in OpenAPI format.
- The parameters of the snmp-trap connector now includ an additional parameter that allows you to specify an OID, which is a MAC address.
- The KUMA installer checks the status of SELinux.
- Creating a backup copy of the Core using the "/opt/kaspersky/kuma/kuma tools backup" command line utility is no longer supported
- Certain obsolete normalizers are no longer supported or provided:
- [Deprecated][OOTB] Microsoft SQL Server xml
- [Deprecated][OOTB] Windows Basic
- [Deprecated][OOTB] Windows Extended v.0.3
- [Deprecated][OOTB] Cisco ASA Extended v 0.1
- [Deprecated][OOTB] Cisco Basic