klactgui tool for remote troubleshooting of managed computers in Kaspersky Security Center
Show applications and versions that this article concerns
- Kaspersky Security Center 14 (version 14.0.0.10902)
- Kaspersky Security Center 13.2 (version 13.2.0.1511)
- Kaspersky Security Center 13.1 (version 13.1.0.8324)
- Kaspersky Security Center 13 (version 13.0.0.11247)
The klactgui diagnostics tool allows performing the following actions on the remote computer:
- Enable and disable traces
- Change the trace level
- Download the trace files
- Download applications settings
- Download the GetSystemInfo report
- Download event logs
- Start and stop applications
- Run Network Agent diagnostics
- Generate and download application dumps
- Load and run tools and download their results
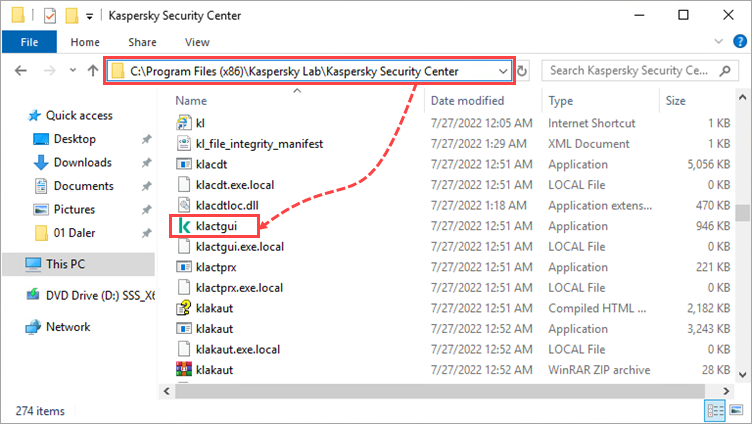
The klactgui.exe tool is located in the Kaspersky Security Center installation folder on a computer with the Administration Server installed. The default path is C:\Program Files (x86)\Kaspersky Lab\Kaspersky Security Center.
Klactgui tool description
The tool is compatible with Network Agent, Administration Server, and Kaspersky Endpoint Security for Windows.
The tool is not compatible with Kaspersky Endpoint Security for Mac and Kaspersky Endpoint Security for Linux.
The tool can be connected to a remote device in one of the following ways:
- Using Administration Server. The connection is established through the Administration Server to which the managed computer is connected. If the computer belongs to the secondary server which cannot be accessed directly, you can try connecting through the primary Administration Server.
- Using Microsoft Windows network. To connect in this mode:
- Ports TCP 139, TCP 445, UDP 137, UDP 138 must be open on a managed device.
- For connection, the local administrator account must be used (access to Admin$ and service creation rights are required).
Limitations
- Stopping the application is only possible if the related service supports the stop command.
- Enabling and disabling traces for applications with enabled self-defense is available inly if Network Agent is installed on the managed computer.
How to run the tool and connect to the managed computer
How to connect using Administration Server tools
- On a device with Administration Server or Administration console installed, run the tool in one of the following ways:
- Start → Kaspersky Security Center → Kaspersky Security Center Remote Diagnostics Utility
- From the Kaspersky Security Center installation folder: <Drive>:\Program Files (x86)\Kaspersky Lab\Kaspersky Security Center
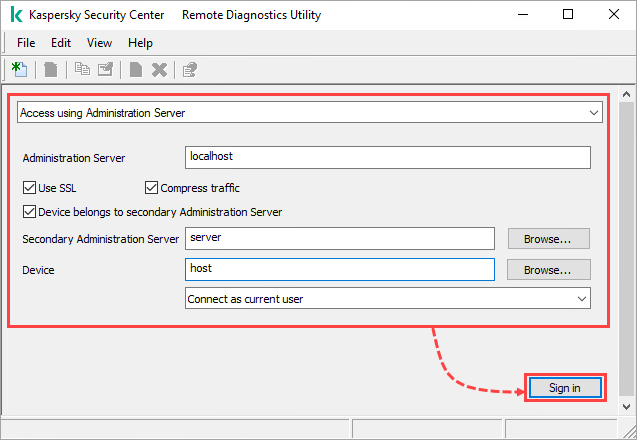
- Select Access using Administration Server.
- Specify the name of the server to which the managed device is connected in the Administration Server field. If the managed device is connected to a secondary server, specify the name of the primary server, select the Device belongs to secondary Administration Server checkbox and specify the name of the secondary server.
- Specify the name of the managed device in the Device field.
- Specify the account with administrator permissions on the Administration Server. If you choose the option Connect as current user, the tool will be launched under the current account.
- Tap Sign in.
How to connect using Microsoft Windows network tools
- On a device with Administration Server or Administration console installed, run the tool in one of the following ways:
- Start → Kaspersky Security Center → Kaspersky Security Center Remote Diagnostics Utility
- From the Kaspersky Security Center installation folder: <Drive>:\Program Files (x86)\Kaspersky Lab\Kaspersky Security Center
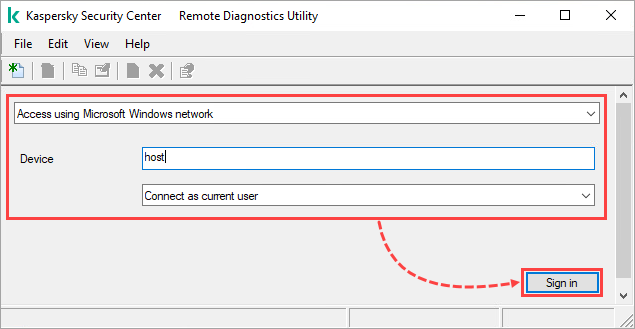
- Select Access using Microsoft Windows network.
- Specify the name of the managed device in the Device field.
- Specify the account with local administrator permissions on the managed device. If you choose the option Connect as current user, the tool will be launched under the current account.
- Tap Sign in.
How to enable and disable tracing and download trace files
- Connect to the managed device.
- Select the application for which traces will be collected and click Enable tracing.
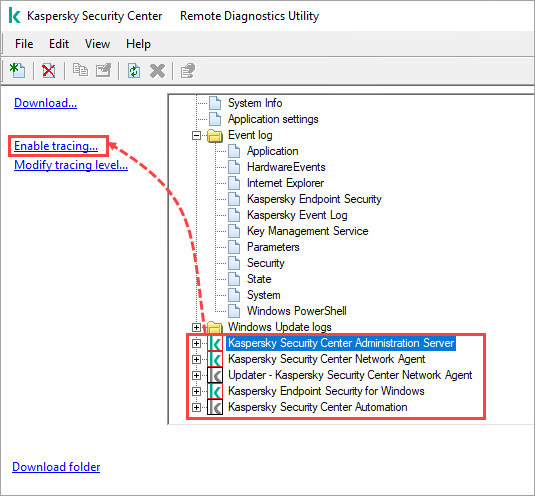
Enabling and disabling traces for applications with enabled self-defense is available inly if Network Agent is installed on the managed device.
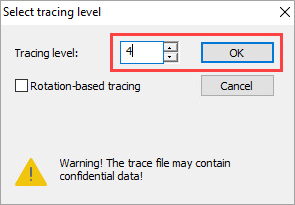
- Select the tracing level and click OK.
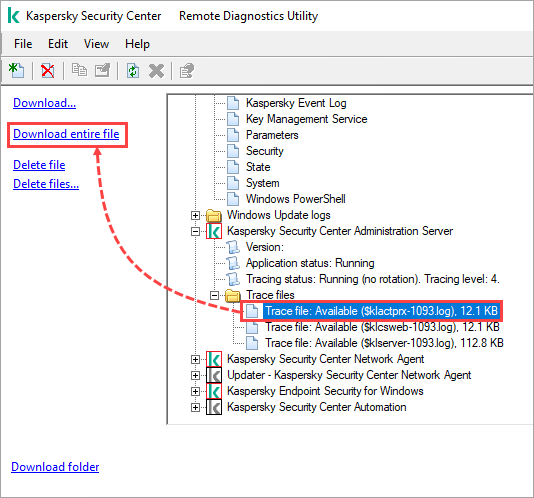
- Go to the Trace files folder, select the file and click Download entire file.
- To disable traces, select the application for which tracing was enabled and click Disable tracing.
How to download application settings, create and download dumps, download and run tools
- Connect to a managed device.
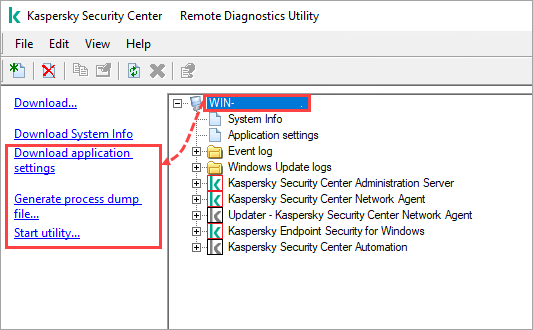
- Find the managed computer’s name and click one of the links:
- Download application settings, to download the settings of Kaspersky applications installed on the remote computer.
- Generate process dump file, to collect and download the dump file of the specified application.
- Start utility, to run a tool on a managed computer and get the results.
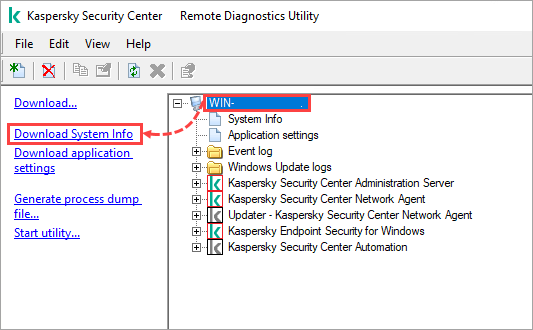
How to download a GetSystemInfo report
- Connect to the managed device.
- Select the managed device in the list.
- Click Download System Info.
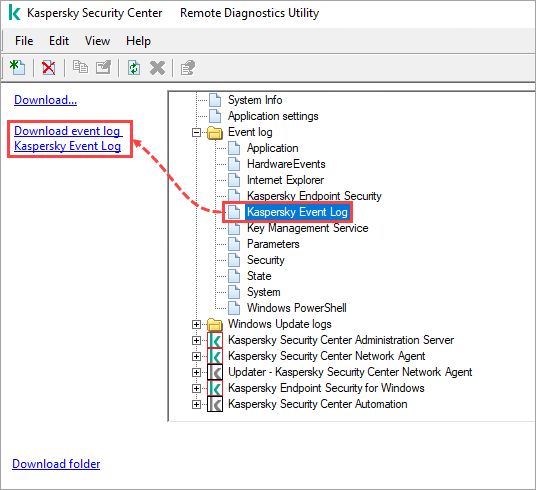
How to download Event Log
- Connect to a managed device.
- Open the Kaspersky Event Log folder and find the log to download. Click Download event log Kaspersky Event Log on the left.
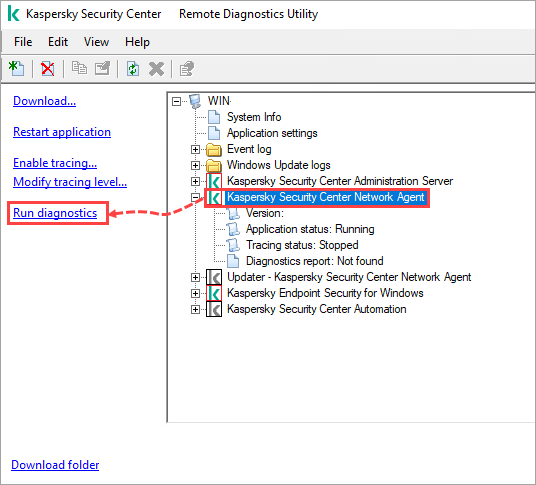
How to run diagnostics and download the report
- Connect to a remote device.
- Select Kaspersky Security Center Network Agent in the right frame and click Run diagnostics on the left.
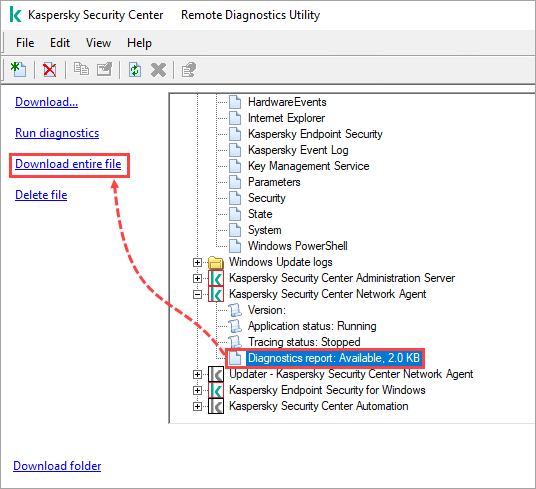
- Wait until the report is generated.
- Select Diagnostics report in the right frame and click Download entire file.
How to run, stop or restart an application
Stopping the application is only possible if the related service supports the stop command.
- Connect to a remote device.
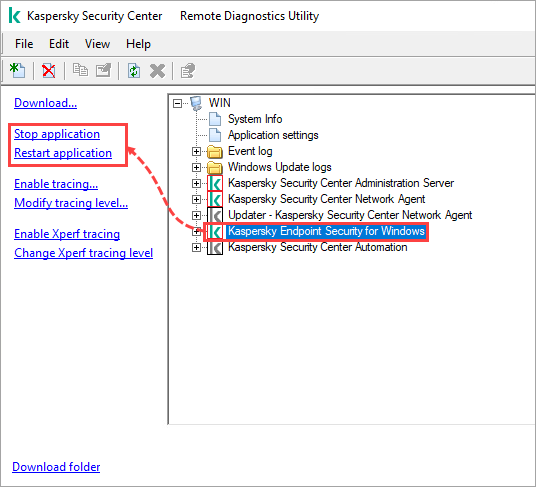
- Select the application in the right frame and the action in the left area:
- Start application
- Stop application
- Restart application
